Proxmox/Jellyfin Server

AlphaObeisance

Active Member
Joined
Nov 7, 2022
Messages
120
Reaction score
84
Credits
1,705
Forgive me, as I'm writing this as I wake up and sip on my first coffee of the day so this may be a down right dumb question.

I've been using Proxmox for a while now, and one of the first services I got into self hosting was Jellyfin Server for my own media streaming service based on my own media libraries.

Everything seems to have run very well for me ever since, but I have made an observation I don't quite understand.

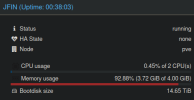
On the Proxmox Dashboard Summary of the VM I created to host this service shows that the dashboard indicates a 90%+ memory usage at all times. Now, while I do only have 2 cpu's and 4GB of RAM currently, I have given it an excessive amount of resources (32 cpus, 64GB RAM) and the results were the same.
1719325140290.png

I thought to myself it must be some kind of memory leak, or the fact that I have a massive library of media content maybe the library scans take so long that they pretty much never stop, as it's scheduled for daily restarts and the scans may need more time to complete (I'll have to look into that further).

BUT, here's the interesting part.

1719325091466.png


Htop from within the VM indicates the server is only using 1.5GB/4GB and 125MB of swap.

Is there anyone out there more savvy than I that might be able to shed some understanding on why Proxmox is reporting such high system resource usage while the system itself seemingly indicates all is well? I'm still learning about Proxmox and hypervisors so I apologize if this is a relatively simple answer. It merely made me curious.

The server itself generally performs without issue. The extent of complications I've encountered is that if the server has run all day, shows tend to require a bit of buffering prior to watching. Resolved by manually restarting the server, or waiting for buffer time.
 

Attachments

  • 1719325163513.png
    1719325163513.png
    22.8 KB · Views: 22


Your CPU is barely being used. The only resource that looks high is RAM.
I don't use Jellyfin, but I know many media servers will reserve all the RAM they can find.
Typically, they load as much content as possible into RAM, so there is no buffering or caching.
This is usually based on popularity. The more times specific content is viewed, the more likely
it is to be in RAM.

If the media sharing is working fine with low RAM resources, I would just leave it there.
If this is video streaming media, the other resource to watch is network interface traffic.
We have overloaded a single 1GB interface with only 15 clients before. To get around this
we use dedicated media servers ( not VMs ) with multiple high speed network interfaces.
Most have 10GB or 40GB network interfaces.

But this depends on many things. How many client connections? How big are the files? What is the resolution
of the content? 32bit 384Hz takes more bandwidth than 24bit 256Hz for example.
4k video takes more bandwidth than 1080p video.
 
Last edited:
Yeah CPU typically looks really good unless doing a library scan in which case it caps out at 95-110% but drops back down after task complete.

I suppose it just doesn't make sense to me how the Proxmox Dashboard and Htop don't reflect even remotely similar resource usage. And this is a private service utilized only on the LAN for family, so at most we have 2-3 connections, but average really only 1 stream at a time, 2 if my eldest is watching something too.

I'd actually been able to run Jellyfin without issue on 2 cores and 2GB RAM in the past and Proxmox showed similar usages, but as mentioned in the OP, regardless of resource allocations RAM is always seemingly capped. Would make sense reading what you'd shared in that the library is so huge (and my wife and I have been binge watching the walking dead) so maybe it's like you'd stated and it's just caching a ton of data to make that quickly accessible.

Still doesn't clarify the inconsistency between reported resource usage between Proxmox/Htop though, which is where i'm most confused. Where as Htop shows nearly non existent CPU usage (obviously good), and RAM isn't even reported as being over half of the 4GB it's been given; while on proxmox it shows as being completely maxed out.

My only conclusion is that the Proxmox resource usage summary on the hypervisors dashboard is reporting based on how Proxmox is managing the VM's resource and is entirely segregated from the data reported from within the VM. Not sure how to explain what I'm thinkin here.

Basically I would assume Proxmox is thinking "Hey, you have me 2 cores and 4GB RAM, so I'm a CAP the ram to make it more responsive; reporting on the usage from the Proxmox side; making 100% of the resources readily available from within the VM. And Htop is reporting from within the system and see's that Proxmox has made available 2 cores and 4GB RAM, and reports only what is actively being used at that moment by the VM?

So Proxmox is basically saying "Here, I'm giving you 100%"
And Htop is basically saying "Righteous, thank you, but I'm only gonna use this much right now"?
 
My only conclusion is that the Proxmox resource usage summary on the hypervisors dashboard is reporting based on how Proxmox is managing the VM's resource and is entirely segregated from the data reported from within the VM. Not sure how to explain what I'm thinkin here.

So, this is right but... some caveats.

If I have a host machine with 64GB, and a VM on that machine using 8GB.

Most host computer might say I'm using 16GB. 8 for the host system, and 8 for the VM.
Now my VM might say I'm using 90% of it's resources, well it only knows about the resources in that VM.
So that means it's using 90% of the 8GB allocated to it.

But on my host computer, I should still only be using 16GB of my 64GB.

Now maybe I'm running 4 or 5 VMs. And each VM has 8GB of RAM allocated to it.
well 5 x 8 = 40GB. So now, out of my 64GB on the host, I'm using 8GB just for my host to be running,
but also 40GB to support the VMs. So now it says I'm using 48GB out of my 64GB.

I'm exaggerating a little here, because most hypervisor software only only reports what's
being used, not necessarily what was allocated. But you get the idea, I'm talking worst case here
where every VM is actually using all the RAM allocated to it.

Now while the host is 48GB. which comes out to about 70% or so of my 64GB.
Each VM is using 7.9 of the 8GB allocated to it. So it's using 95% of it's RAM.

The VM should be isolated from the host. That's the whole purpose of having VMs.
Whatever resources are allocated to the VM, that's all it knows about.
Htop from within the VM indicates the server is only using 1.5GB/4GB and 125MB of swap.

The picture you posted above says it's using 3.72 out of 4GB.
 
I appreciate the info. My rack currently has x2 Xeon Processors and 220GB of RAM (expandable to nearly 1TB). And currently I only have about 3 services running as I'm doing some reconfiguration, which is where a lot of my confusion comes from, as there really isn't anything going on.

The picture you posted above says it's using 3.72 out of 4GB.

Yes, that is the Proxmox Dashboard VM summary for JUST the Jellyfin server's VM, not proxmox overall. The Htop picture I shared below that indicates the VM is only using 1.5GB/4GB and 125MB of swap.

If we're talking overall Hypervisor summary, it's using 0.23% of it's CPU, and 8.89% RAM and only 2.41% of swap. Again, this is the overall Proxmox summary for the node, and the issue lay within the Proxmox summary of resource usage particular to a single VM.
 

Members online


Latest posts

Top